SRKW Annual 2023
As we continue our look back at 2023, here is our annual map for Southern Resident presence across all four seasons of last year.
There was a 24% decline in Southern Resident sightings compared to 2022, with a particularly noticeable drop in the summer and fall. J-Pod spent some time in Puget Sound in the spring, which they did not do in 2022, and all three pods continued to spend more time in the western Strait of Juan de Fuca in the summer rather than visiting what used to be their historic core range around the San Juan Islands.
The decline in Southern Resident summer presence is clearly the new normal at this point, but it's still remarkable to look back at just how quickly and how dramatically it has changed. 20 years ago, the Southern Residents were spending an average of more than 80 days in the Salish Sea in the months of June through August. For 2019-2023, that average has dropped to just 20 days.
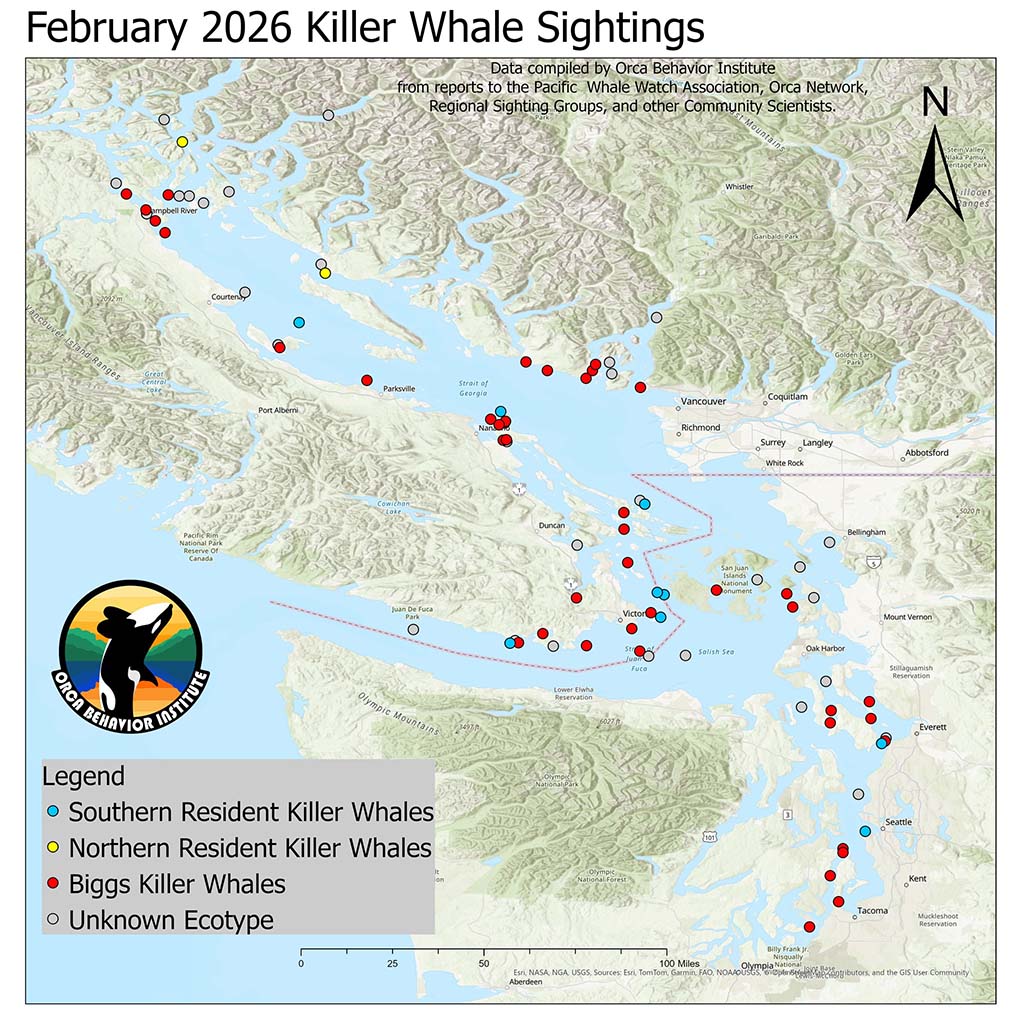
Note that this map is showing sightings, defined as a unique group of whales seen on a unique day. On some days, there were multiple groups of Southern Residents in the Salish Sea in different regions, so the number of sightings does not equal the number of days seen.
Thank you as always to our extensive sightings community for helping to make this type of monitoring possible. It truly takes a village from north to south and east to west to track whale sightings on this scale, and particularly when it comes to an endangered species, this type of data is crucial to track to make sure that any seasonal or regional management measures being put into place overlap with how the whales are actually utilizing their critical habitat.